

Omnichannel Didn't Add a Channel. It Added a Second Demand Pattern.

Christian Timotti
Supply Chain across the US, Brazil and Latin America · October 12, 2026
Most omnichannel inventory problems are not about having too much or too little stock. They arise when the right total is in the wrong place because the business added a channel but continued forecasting as if it had only one. Here is what that costs, how to spot it, and what fixing it involves.
The monthly review says the number is fine. Total inventory is on plan, availability is acceptable, nothing is on fire. And yet the business is expediting most weeks, one channel is quietly being disappointed to serve the other, and nobody can explain why.
I have seen this in consumer goods, in furniture, in nutrition, on two continents. The pattern is consistent enough that I now ask about it in the first conversation.
It almost always traces back to a single decision nobody remembers making: when e-commerce was added, the planning process was not changed to match.
One SKU, two behaviors
Store replenishment and direct e-commerce are not two sizes of the same demand. They are different demand, and they only look alike because the same part number sits underneath both.
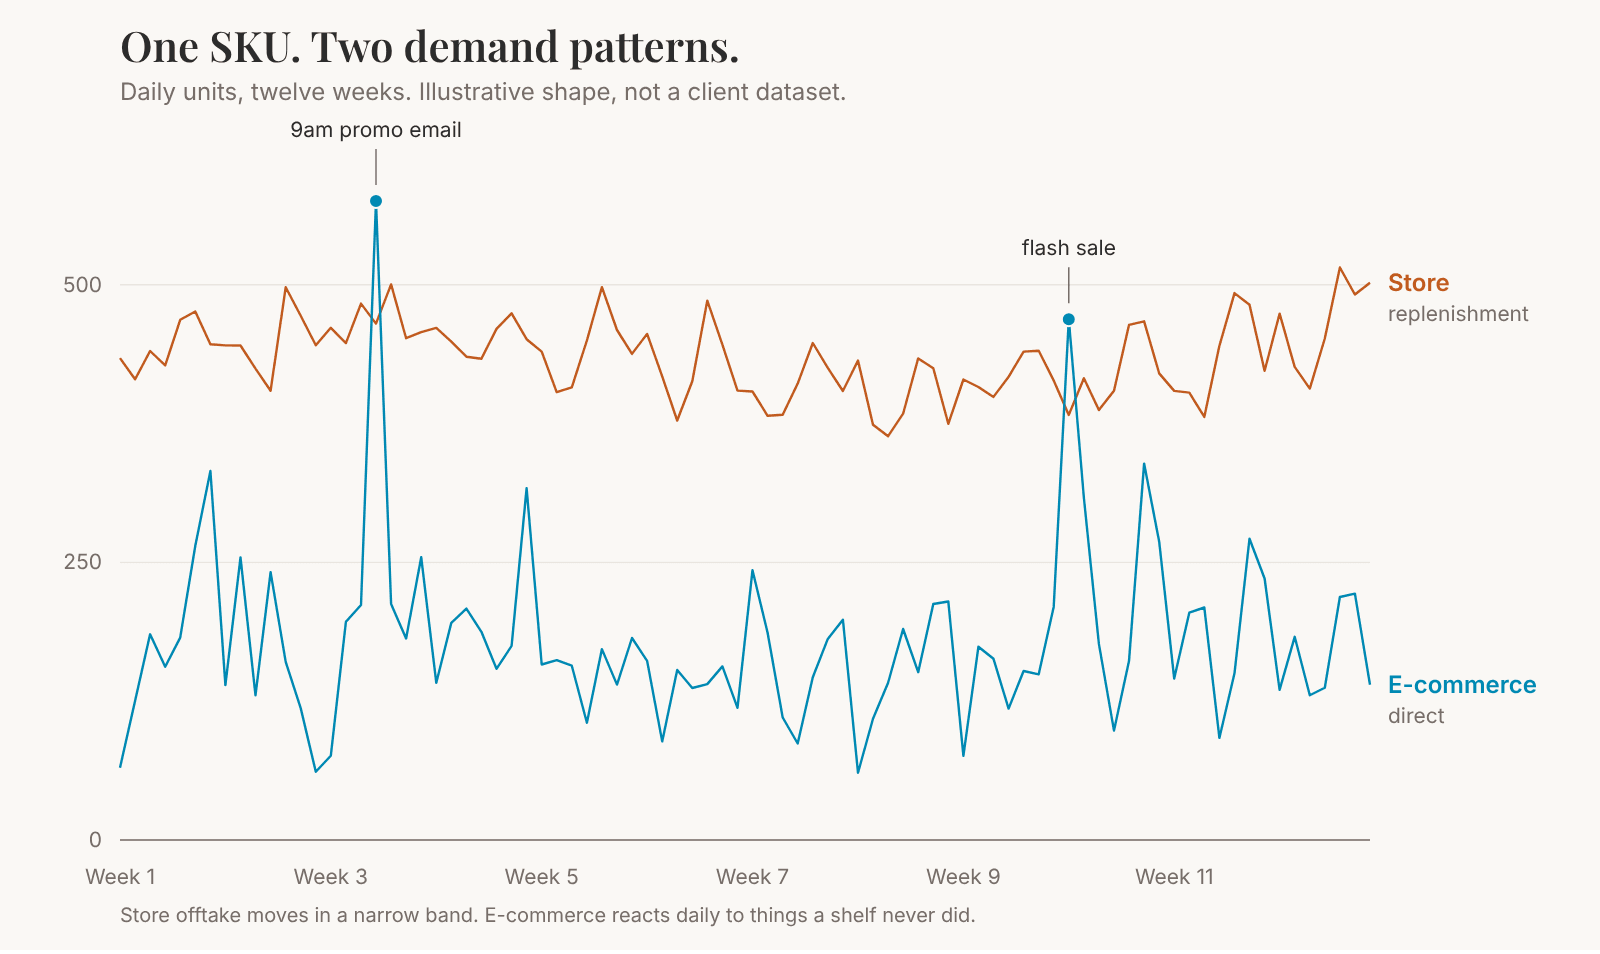
Store offtake moves in a reasonably narrow band. It is smoothed by shelf capacity, by planogram, by a replenishment cycle that imposes its own rhythm. You can plan against it, and a month-ahead forecast is usually close enough to act on.
E-commerce has none of that smoothing. It is daily, it is spiky, and it responds to things a shelf never did. A promotion email going out at nine in the morning. Somebody with reach posting at midnight. A flash sale that was agreed in a commercial meeting you were not in.
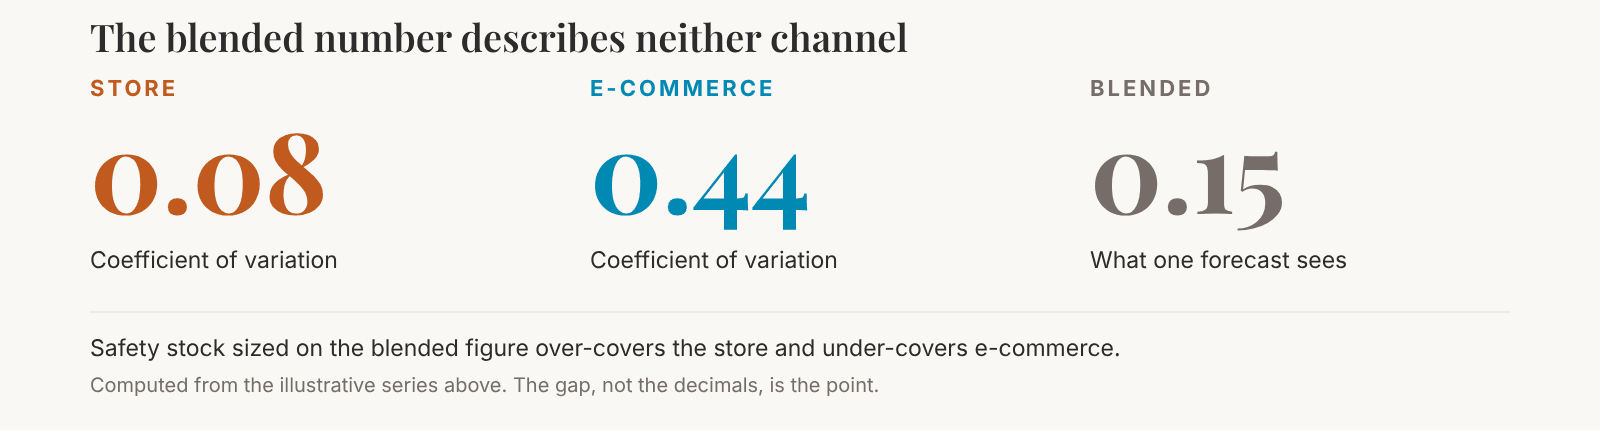
Look at what that does to a single number. In the chart below, the store channel has a coefficient of variation of 0.08, which is a measure of how far demand swings around its own average. E-commerce is 0.44. Blended, one forecast sees 0.15.
That blended figure is the problem, and it is worth being precise about why. Size safety stock on it and you over-cover the store while under-covering e-commerce, every single cycle, with a number that looks defensible on the page.
0.15 is not a compromise between the two channels. It is dominated by the larger, calmer one, and it describes the volatile channel not at all.
Why the aggregate hides it
This is not only a planning-system problem. The same illusion operates at national scale, which is why it is so easy to miss internally.
The US inventories-to-sales ratio fell from 1.39 in June 2025 to 1.30 in June 2026, which reads like a year of disciplined inventory management. Inventories over that period rose 3.0%. The entire improvement came from sales growing 10.0%, and a meaningful share of that was price rather than units.
The ratio improved. The inventory did not. Aggregates do that: they are arithmetically true and behaviorally useless, and a monthly review built on them will keep reporting that everything is under control right up until somebody has to explain the expedite bill.
MIT's Center for Transportation and Logistics put the question to 647 supply chain leaders in its 2026 omnichannel study. Fifty-three percent named inventory positioning and demand planning as an operational challenge. The sample skews to large omnichannel businesses, which for this argument is the relevant population rather than a limitation.
Do you have this problem?
Four diagnostics, none of which require a project to run. You can get all four from data you already hold.
- Forecast error by channel — Compared with forecast error on the blended number. If the blended figure looks materially better than either channel on its own, you are measuring the average and not the business.
- Service level by channel, not in aggregate — Two channels at 94% is a different operation from one at 99% and one at 89%, and the aggregate cannot tell them apart.
- Expedite frequency, split by which channel triggered it — If one channel generates most of your emergency freight while holding a minority of the inventory, that is the gap wearing a different label.
- The honest version of the question — Can you see demand by channel at SKU level today, at all? A surprising number of businesses discover the answer is no, and that the data was never captured separately.
The part most people get wrong: pooling
The instinct, once you see two patterns, is to pool inventory to cover both. Pooling is a real and well-established benefit, and it is also where this goes wrong most often.
Pooling reduces variability when the demand streams are not strongly correlated. The benefit scales with how different the streams are, which sounds like an argument for pooling these two aggressively. But the benefit is only realizable if the pooled stock can actually reach either channel in the time each one requires, and that is usually where it fails. E-commerce needs same-day picking from a location configured for singles. Store replenishment needs pallets. Stock pooled in a form that serves one cannot serve the other without a handling step nobody costed.
So the sequence matters, and it is the opposite of what most projects do:
- See demand separately at SKU level first — You cannot make a sound pooling decision on data you have never separated.
- Then decide, per segment, whether to pool, position, or split — Not as a blanket policy.
- Only then change where physical stock sits
And not for every SKU
Here is the trade-off that keeps this honest. Separating demand by channel for your entire catalog is expensive and mostly wasted. Most SKUs do not need it.
The ones that do share a profile: meaningful volume in both channels, a high ratio of e-commerce variability to store variability, and a service commitment that makes a stockout expensive. That is usually a minority of the range and a majority of the pain. Run the segmentation before the build, and the project halves.
For the rest, a blended forecast is genuinely good enough, and saying so out loud is what makes the case for the important SKUs credible.
What it costs
This is the paragraph that separates an operator's version of this argument from a software vendor's.
It is a real data build. It needs somebody to own channel-level demand, as a named job rather than an extra line in a planner's week. And for several months you will carry both the old safety stock and the new visibility work, because you cannot responsibly take the buffer out before you trust the new view. Nobody enjoys funding that overlap.
What makes it defensible is the comparison.
It costs less than the buffer you are already carrying to cover a blind spot you have chosen not to look at.
A ninety-day sequence
If you want to test this without committing to a program, this is the shape I would use.
Four decisions, one owner, and a result you can show a CFO. That is a very different proposition from a demand planning transformation, and it is the version that tends to get funded.
- Weeks 1 to 3 — Pull twelve months of demand by channel for the top SKUs by value. If the data does not exist separately, that finding is itself the result, and it is worth knowing in three weeks rather than three quarters.
- Weeks 4 to 6 — Compute variability and forecast error by channel, and compare against the blended figures you have been using. Segment into the SKUs that need separate treatment and the ones that do not.
- Weeks 7 to 10 — Re-size safety stock for the separated segment only. Leave everything else alone, so the comparison stays clean.
- Weeks 11 to 13 — Measure service by channel and expedite frequency against the prior quarter. Then decide whether to extend it.
Sources
US Census Bureau, Manufacturing and Trade Inventories and Sales, June 2026, released 14 August 2026. Figures are nominal, so part of the sales growth reflects price rather than units.
MIT Center for Transportation & Logistics, 2026 State of Omnichannel Supply Chain Report, May 2026. 647 respondents, 72% from companies above 1,500 employees; self-reported.
The demand curves and the coefficients of variation in both figures are modeled for illustration. They are not drawn from any client engagement.
Reflection
Can you see demand by channel at SKU level today?
Or are you pooling inventory against an average that no single channel actually behaves like? If it is the second, the number in your monthly review is not wrong. It is just describing a business you do not have.
Before you close this
Who came to mind while you were reading?
If someone you work with would recognize themselves in one of these signals — or would sleep better knowing what to look for — send it to them. It is a shorter conversation than the one that happens two years from now.
About the Author
Christian Timotti
Founder of Carpe Omnia. 20+ years of executive experience in supply chain, operations, and leadership development.